|
|
If you feel like you've got cabin fever, check out some new releases to help you make it through the pandemic:
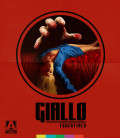
Giallo Essentials - Three of the best films from the influential Italian horror genre. And don't miss three more greats in Volume II!
New 4K releases include the JCVD/John Woo, New Orleans-set people-hunting extravaganza, Hard Target, Barry Sonnenfeld's spooky comedy, The Addams Family, and the critical darling The Wolf of Wall Street.
Finally, Arrow's 4K release of Dario Argento's Deep Red is the best of both worlds!
Check out our forums to stay up-to-date on entertainment news as it develops!
Be sure to check out our DVD Talk Review Database for all the latest reviews including an entire section devoted to reviews of DVDs out this week.
The Season of the Witch is upon us, so let's take a look at some of the best horror releases of the past year!
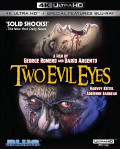
Two Evil Eyes - horror legends Dario Argento and George Romero direct two Edgar Allan Poe tales, updated to 1990. It's about as much spooky pedigree as you can cram into a project; speaking of classics, check out the Criterion Collection's release of Nightmare Alley, which is now being remade by Guillermo del Toro; and if you want something weird, our reviews for Arrow Video's release of the Florida-sploitation collection He Came from the Swamp: The William Grefe Collection.
And it's never too late to join the 17th Annual October Horror Movie Challenge in our forums!
Be sure to check out our DVD Talk Review Database for all the latest reviews including an entire section devoted to reviews of DVDs out this week.
 Intro to Asian & Pacific Islander Film:
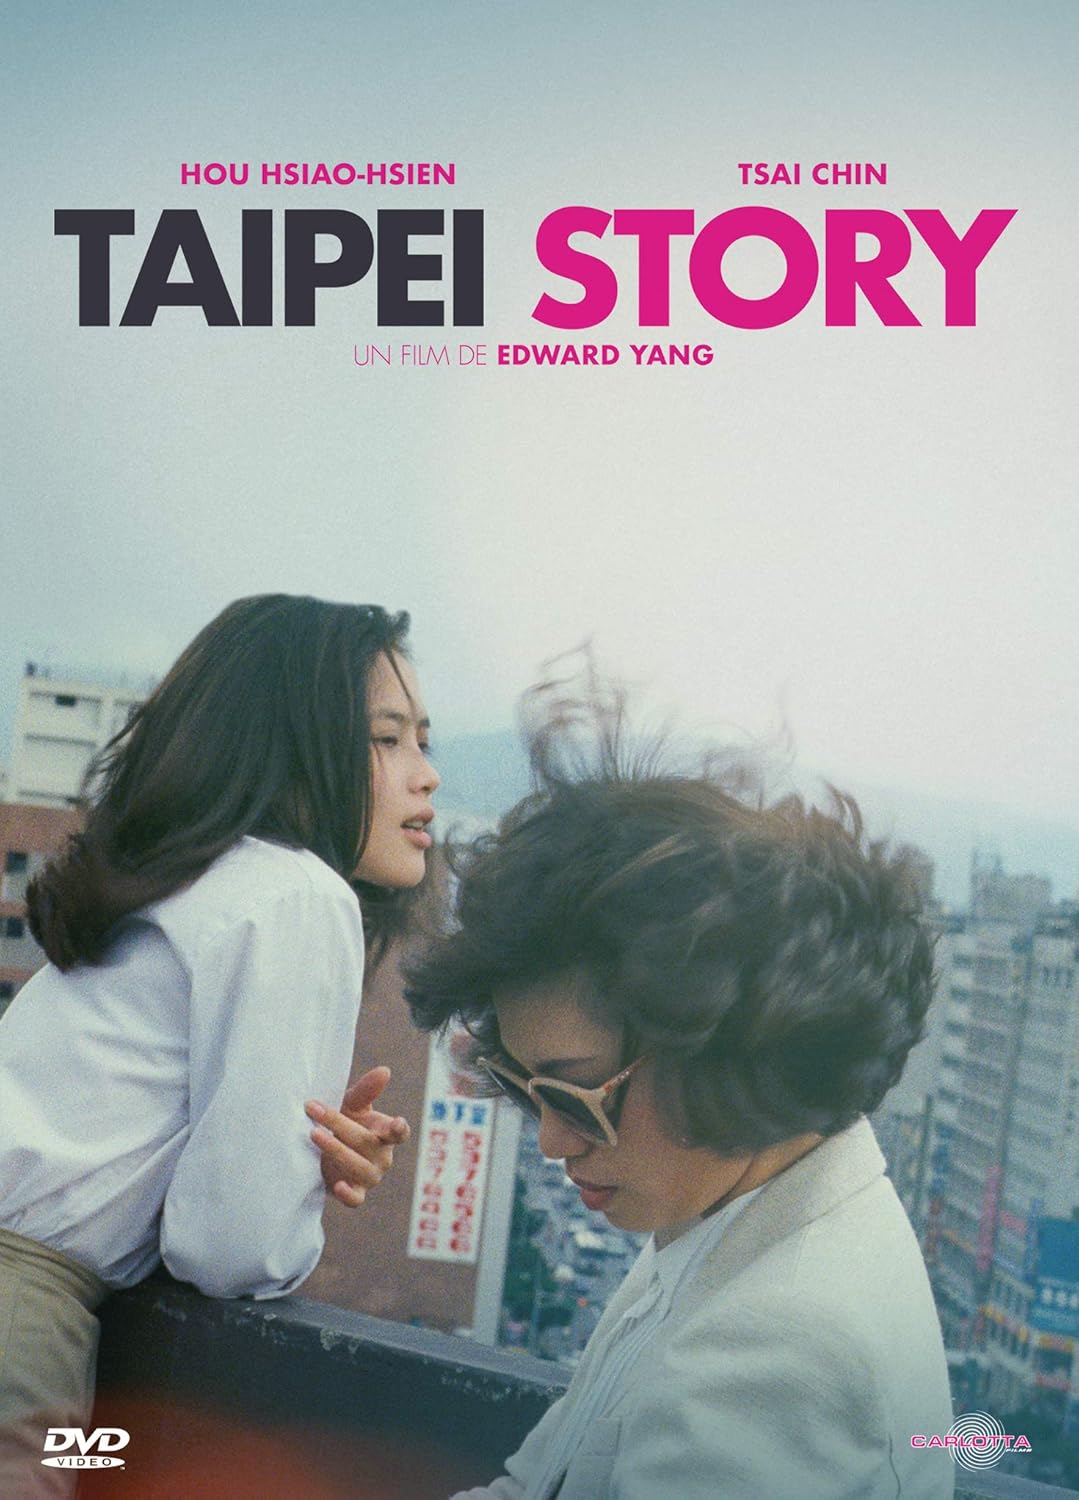
The place to start is definitely The Criterion Collection's , World Cinema Project No. 2. Curated by Martin Scorsese, this collection focuses on pieces from Asia, including the seminal Insiang (Philippines) and Taipei Story (Taiwan). If you're looking for more "action" than "arthouse", Criterion also released a double feature of Police Story and Police Story 2 (Hong Kong). The films cemented Jackie Chan as one of the greatest stuntmen, choreographers, and action directors of all time (and possibly, actually insane). If you're looking for comedy, Taika Waititi's Jo Jo Rabbit (New Zealnd) is a scathing satire of Nazi Germany. And the elephant in the living room: Parasite (South Korea)! If you haven't seen it, what are you waiting for?
Presitge:
Hiroshima (Japan): A harrowing look at the effects of the Little Boy nuclear attack on the city. A less bleak procedural, Park Chan-wook's JSA (Joint Security Area) (South Korea) follows the investigation of a multiple homicide in the DMZ. Modern master Ang Lee's Lust, Caution (Taiwan) similarly explores espionage and intrigued, but was overlooked at the time of its release by receiving a death knell label of NC-17 from the MPAA. For something more potentially more relatable, Bing Liu's documentary, Minding the Gap (USA) follows a trio of friends in a desolate Illinois town as they try to make it as skateboarders. The Yellow Handkerchief likewise shows the universality of the difficulties young people face.
Animation:
Obviously, no review of Asian cinema would be complete without mentioning the massive contributions to animation from that region of the world. And while Hayao Miyazaki's excellence cannot be overstated, there's a ton more out there. There's serious work like Perfect Blue (Japan), which follows an idol singer as she loses her grip on reality. And there's lighter fare, such as the musical mermaid adventure Lu Over the Wall (Japan) and the 3D animation adaptation of the classic manga, Lupin III: The First (Japan). But your viewing should stop with anime! Big Fish and Begonia is a great intro to Chinese fantasy and Satellite Girl and Milk Cow is a beautifully quirky Korean sci-fi romp.
With greater recognition than ever, from Oscar-winning Chloe Zhao to the blockbuster-directing Jon M. Chu and performers as diverse as Akwafina to Steven Yeun to THE ROCK to Temuera Morrison (yes, Boba Fett is a Pacific Islander) to Hiroyuki Sanada to Michelle Yeoh to Jamie Chung, filmmakers of Asian & Pacific Island descent are making films at every level in every genre. That's not even getting into Kurosawa, Ozu, Kar-wai, revolutionary filmmakers without whom the artform would not be the same.
 Silent and Early Film:
Kino Lorber has the terrific collection, Pioneers of African American Cinema, a collection of nearly 30 short and feature-length films from 1915 to 1978. These "race films" (as they were then known) were made outside of the studio system and feature generally lower budgets, but have held up every bit as well as their expensive counterparts.
Blaxploitation:
Shaft and Sweet Sweetback's Baadasssss Song heralded a revolution in American cinema and genre filmmaking. Throughout the 1970s, black audiences could see themselves on the silver screen as heroes, as well as realities they lived daily. The era marked the point at which black audiences were acknowledged and represented. Cult hits like Blacula, Boss, and The Last Dragon were all produced in this time period.
Mainstream:
The 1980s and 1990s saw Spike Lee's frank depictions of black life in his extensive filmography and John Singleton and Mario van Peebles (son of director/writer/star of Sweet Sweetback's Melvin van Peebles) shined a light on the criminal issues faced by modern youth in Boyz N the Hood and New Jack City, respectively. The first black, female filmmaker to have a film shown in US cinemas was only in 1991, with Julie Dash's Daughters of the Dust, paving the way for the likes of Debbie Allen, Kasi Lemmons, and Ava Duvernay. The Wesley Snipes-starring Blade saved the superhero genre the year after the disastrous Batman & Robin and convinced a near-bankrupt Marvel Comics to re-evaluate their film division and eventually led to the Marvel Cinematic Universe. In the 2010s, postmodern hits like Get Out from Jordan Peele and Sorry to Bother You by Boots Riley garnered critical acclaim in their explorations of racial dynamics, while Barry Jenkins' back-to-back Oscar winners Moonlight and If Beale Street Could Talk (the former being the first Best Picture winner with an all-black cast and/or LGBT theme) helped to finally get the recognition black cinema deserves.
From being forced outside of the studios to billion-dollar superhero blockbusters, there have been innumerable black filmmakers, writers, producers, actors like Whoopi Goldberg, Sidney Poitier, Shonda Rhimes, Ryan Coogler, Tyler Perry, Angela Bassett, Idris Elba, Dorothy Dandridge, and too many more to list, who blazed trails, set standards, and continue to push forward.
If you need a little culture in your life, check out these fantastic Criterion Collection releases!
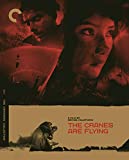
Paris is Burning - dive into the New York drag scene, shining a light on LGBT culture 30 years ahead of its time. If you've ever spilled the tea, thrown shade, or looked fierce, you've been influenced by this film; Czech filmmaker Karel Zeman's Three Fantastic Journeys takes you on a travel through time, through the mind of Jules Verne, and along for the ride with Baron Munchausen in this triple feature; The Cranes Are Flying is a Soviet impressionist feature following the young woman Veronika as she experiences the suffering and loss of World War II in Russia.
Check out our forums to stay up-to-date on entertainment news as it develops!
Be sure to check out our DVD Talk Review Database for all the latest reviews including an entire section devoted to reviews of DVDs out this week.

Need to MOVE? The fastest, spikiest mammal in the world is here to help!
Sonic the Hedgehog - Jim Carrey leads the cast of this adaptation of Sega's little blue mascot (voiced by Ben Schwartz); Adam Sandler gives a tour de force performance as a gambling-addicted jeweler in deep with a loan shark in the Safdie Brothers' Uncut Gems; A Hidden Life is Terrence Malick's latest film follows the tribulations of a devout man who refuses to pledge allegiance to the Third Reich; and Bad Boys for Life is the third outing for the Will Smith/Martin Lawrence buddy cop action series.
Finally, who could forget the controversial final (for now) installment of Star Wars? The Rise of Skywalker has been kicking up a stir with critics and fans alike, so see what all the hubbub is about! And frankly, the 4K cover is pretty cool, regardless of the film quality. Check out our forums to stay up-to-date on entertainment news as it develops!
Be sure to check out our DVD Talk Review Database for all the latest reviews including an entire section devoted to reviews of DVDs out this week.
If you feel like you've got cabin fever, check out some new releases to help you make it through the pandemic:
The Twilight Zone - Jordan Peele takes the reins from Rod Serling in this re-launch of the classic, mind-bending show full of twists, social commentary, and great guest stars; Kino Lorber started off 2020 with a slew of Spike Lee releases, covering much of his early filmography. Check out our reviews for Mo' Better Blues, Jungle Fever, and Crooklyn.
Finally, Universal has released first run films still in theaters to digital platforms, in order to encourage moviegoers to avoid physical contact. You'll be able to rent films like Trolls 2: World Tour, The Hunt, and Emma on Comcast and Sky. Disney joined in too, releasing Frozen 2 early on Disney+. Check out our forums to stay up-to-date on entertainment news as it develops!
Be sure to check out our DVD Talk Review Database for all the latest reviews including an entire section devoted to reviews of DVDs out this week.
Next Page >
|
|